Overview
I presented at TeXConf 2025 on the topic "Automated Grading of Mark Sheet Tests Using \( \mathrm{\TeX} \) Language."
Presentation Details
| Conference | TeXConf 2025 |
| Date & Time | Saturday, November 29, 2025, 14:30–18:00 |
| Venue | Sento Kaikan Conference Room 3F |
| Presentation Title | Automated Grading of Mark Sheet Tests Using \( \mathrm{\TeX} \) Language |
Presentation Content
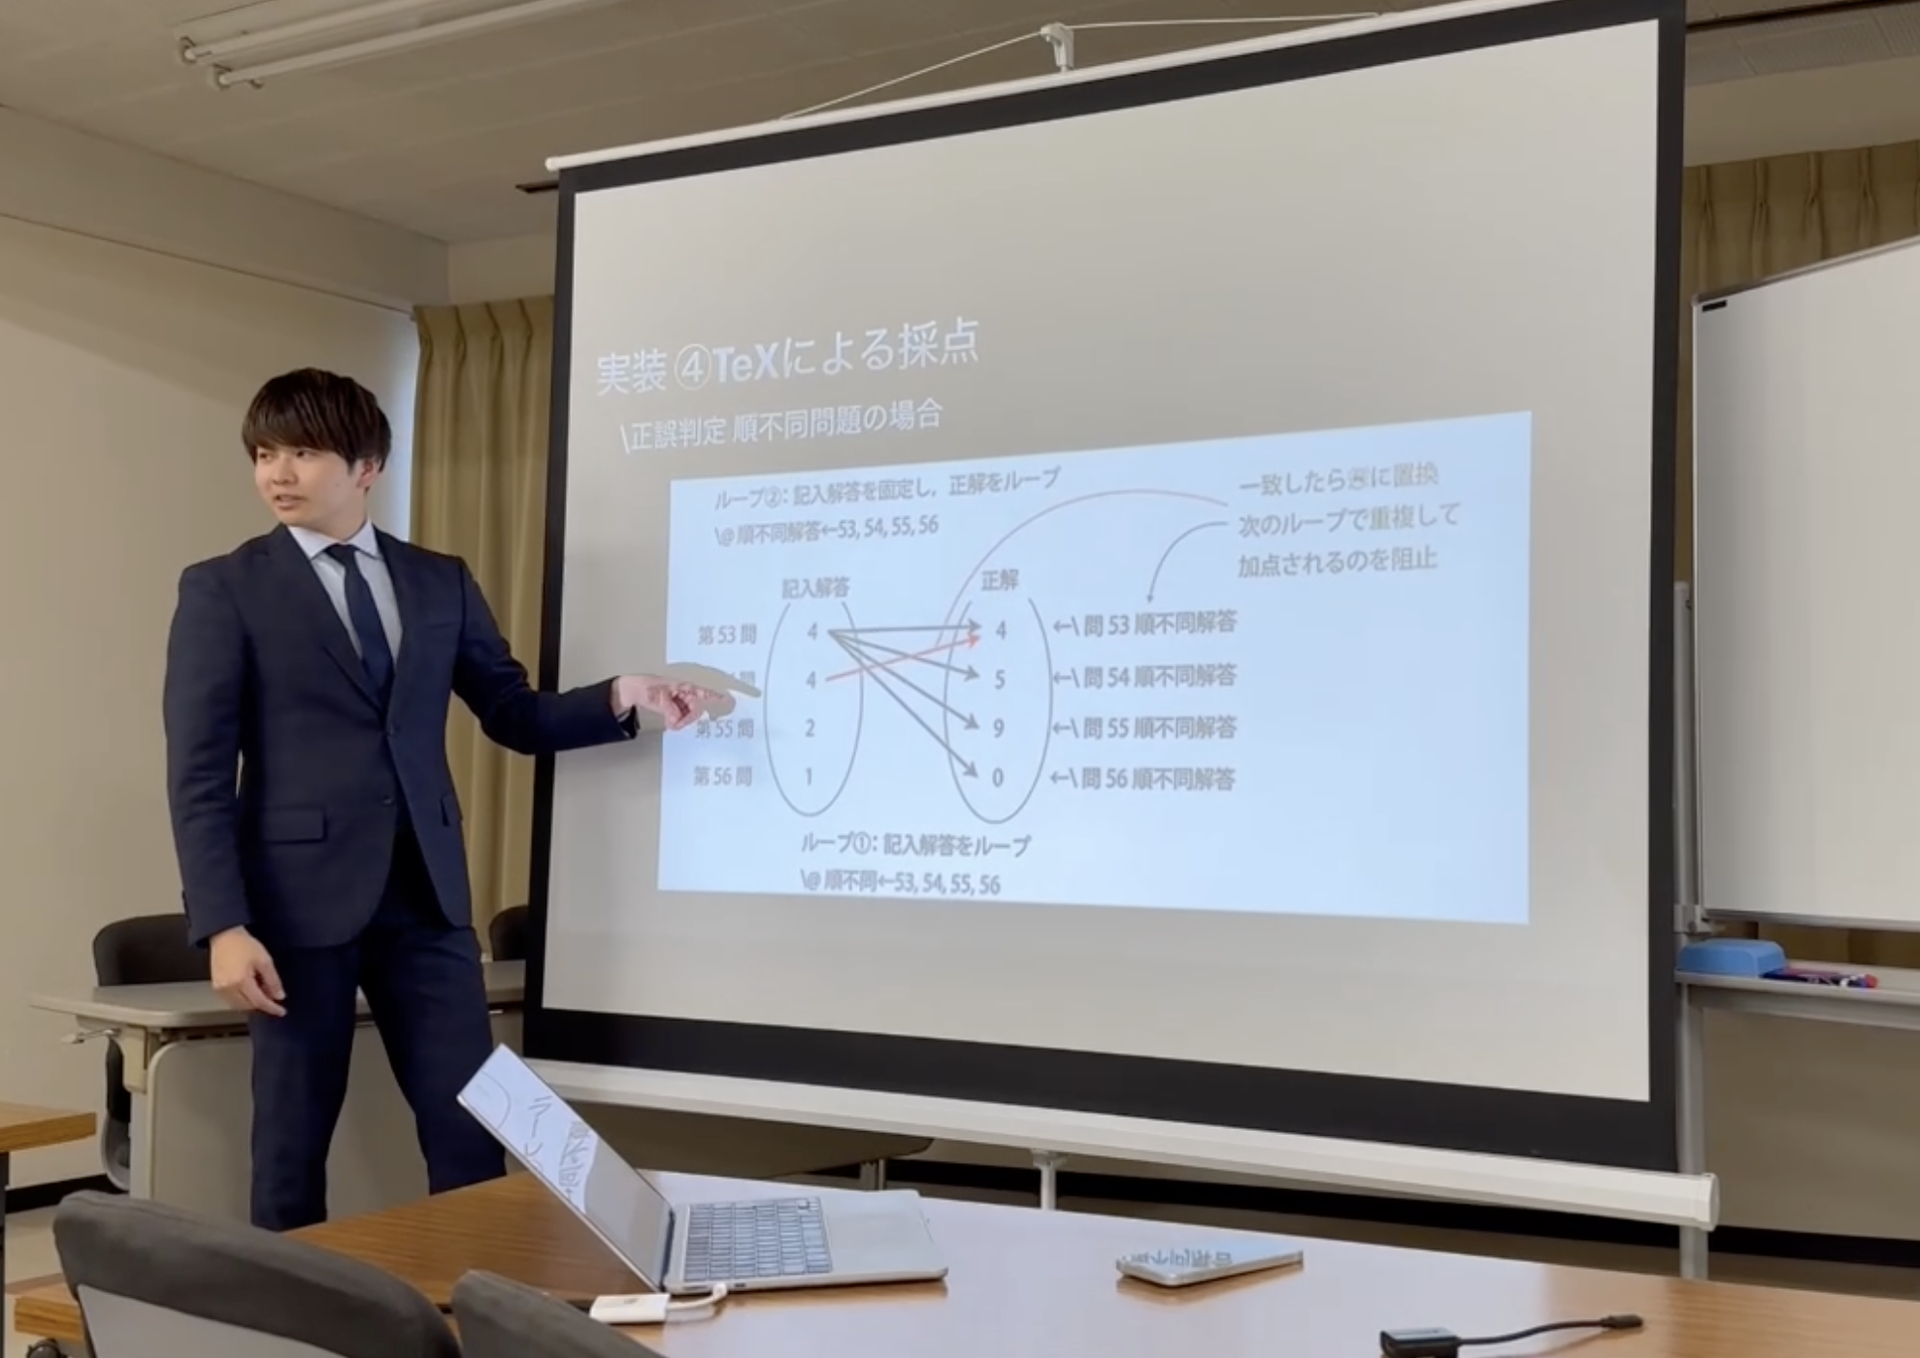
I explained the algorithm for grading mark sheet format tests using \( \mathrm{\TeX} \) language. The presentation covered the entire workflow from dynamic generation of answer sheets to grading, with particular focus on algorithms for grading all-or-nothing questions and order-independent questions using \( \mathrm{\TeX} \).
Currently, to improve usability, the system is wrapped as a macOS application using Swift + Python + \( \mathrm{\TeX} \), making it easy for end users without \( \mathrm{\TeX} \) knowledge to use.
Application Features
The developed application has excellent usability, allowing all of the following processes to be performed through the UI, and is used for standardized test practice sessions at Tetsuryokukai.
Main Features
- Question Set Registration
- Register question numbers, answers, and point allocations
- Set question attributes such as all-or-nothing / order-independent / both
- Question Set Export/Import
- Save and load question sets as files
- Reusable across multiple tests
- Class/Student Roster Registration
- Batch registration of class and student information
- Dynamic Answer Sheet Generation
- Automatically create answer sheets based on question sets for each class
- Personalized mark sheet format
- Automatic Grading Function
- Upload scanned answer sheets
- Automated grading processing
- Supports all-or-nothing, order-independent, and combined question types
- Automatic Generation of Statistical Data and Score Reports
- Basic statistics including mean, standard deviation, highest score, top performers
- Graphs showing the percentage of students who selected each choice for each question
- Frequency distribution tables
- Personalized score report output
Presentation Materials
The presentation materials used can be viewed in the PDF viewer below. If it does not appear, open the PDF directly.